Owner or earner? The 401(k) math
The tax code favors owners. A 401(k) is how an earner starts becoming one.
Owners and earners
There are three economic profiles in the US economy: owners, earners, and consumers. The tax code disproportionately advantages owners.
We all hear how billionaires pay a very low effective income tax rate. This is mostly because they don't have much realized income. Many earn a token salary, then borrow against their huge stock positions, and loan proceeds aren't taxed. To pay the loan back, they sell stock, which is typically taxed at the long-term capital gains rate, usually 15%, versus ordinary income rates as high as 37%.
Every client I advise asks me how to reduce their tax liability. I ask them a very simple question: are you an owner or an earner? The answer for everyone should be "yes."
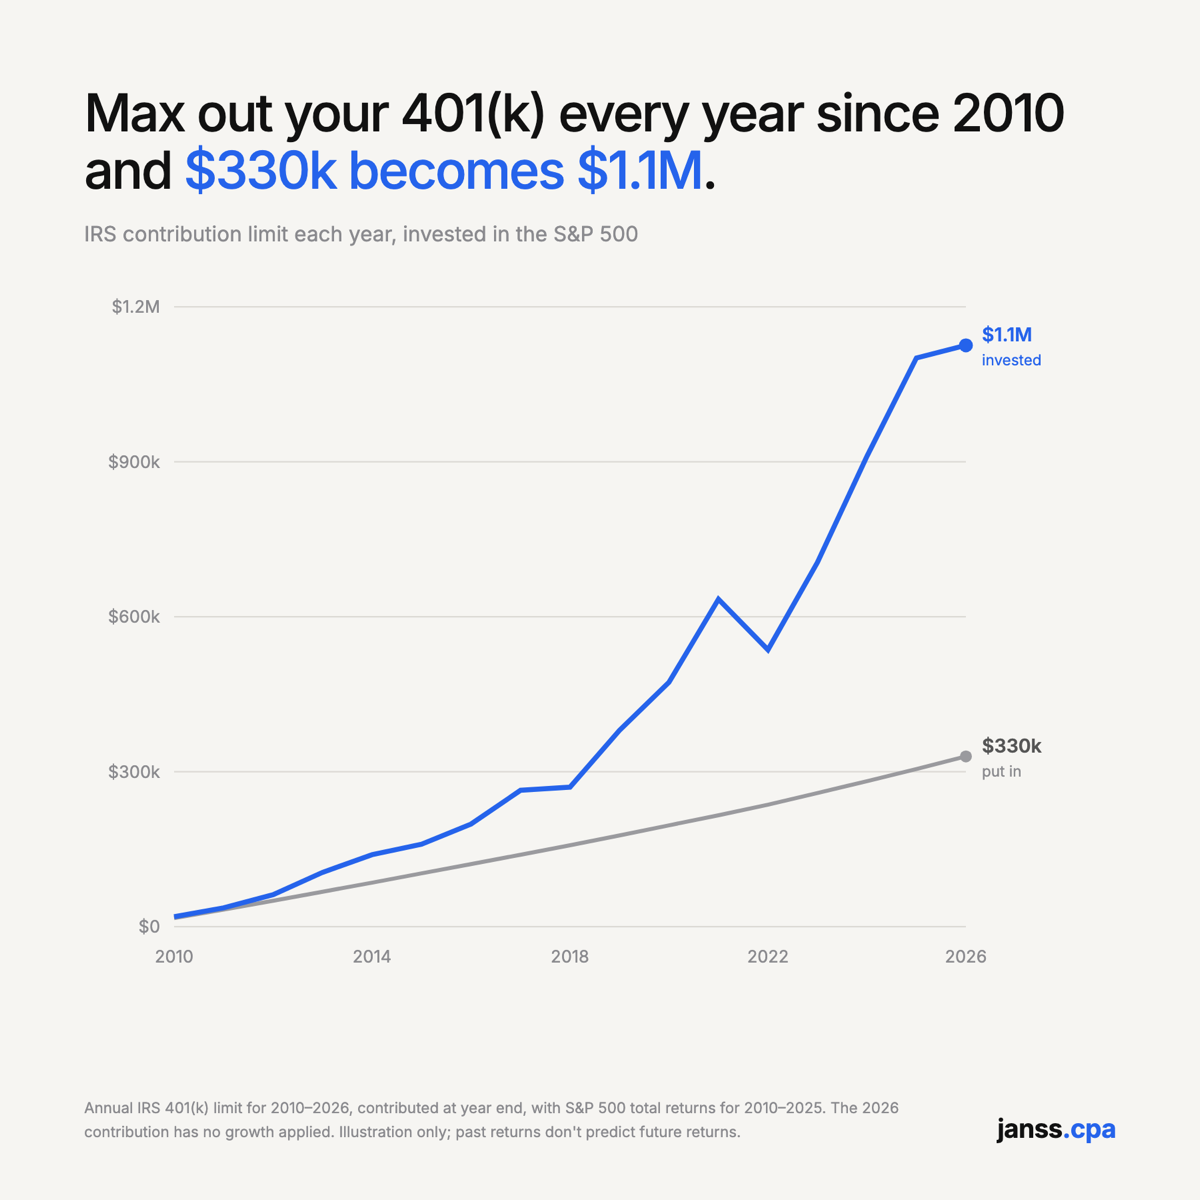
One of the best ways to gradually become an owner is to save for retirement, and you can do that as an earner through your 401(k). The chart below shows what happens when 401(k) dollars go into the S&P 500. The S&P 500 is an index of roughly 500 of the largest US public companies, and it has averaged around 10% a year over the long run.
The gap
The average participant puts in an estimated $9,600 in 2026, well under half the limit. If you had maxed out every year since 2010 and invested it in the S&P 500, you'd have about $1.1 million today on $330,000 put in. The average saver would have about $354,000.
The unit economics
The federal maximum you can contribute to a 401(k) in 2026 is $24,500 a year. Over 24 paychecks, that's roughly $1,000 into your back pocket for another day.
Here is the beautiful part. You are really only putting about $700 in your back pocket. Why? Because the government is contributing the other $300 through lower taxes, assuming a combined tax rate of about 30%. In other words, the government is giving you $300 to save. It just asks that you share in the savings when you withdraw it later.
Let's say you do this for 10 years and the market grows 10% a year. You contribute roughly $17,000 a year, or about $170,000 in total. The government contributes roughly $7,500 a year, or about $75,000 in total.
Here's the thing: the market is also helping you save. After a year in the market, your total contribution, yours and the government's, is $24,500 plus 10%, or $2,450, for about $27,000.
Now fast forward 10 years. The magic keeps working. You contributed $170,000 but have about $390,000. Why? The government contributed about $75,000, and the market contributed the remaining $145,000 just because you owned a piece of the stock market.
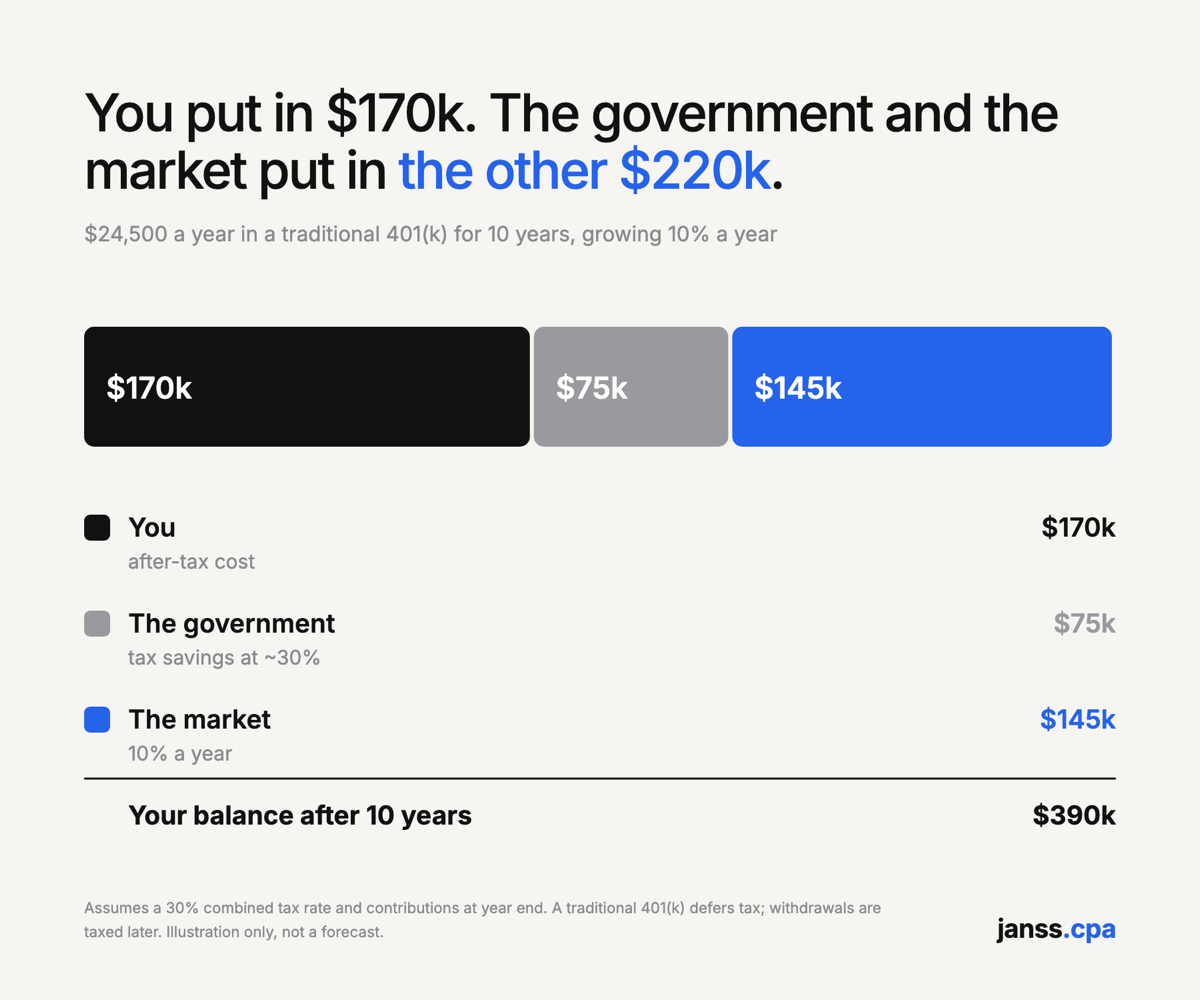
Here's how the rounded math adds up:
| Who put it in | Per year | Over 10 years |
|---|---|---|
| You (after-tax cost) | ~$17,000 | ~$170,000 |
| Government (tax savings at ~30%) | ~$7,500 | ~$75,000 |
| Market (10% a year) | ~$145,000 | |
| Your balance | ~$390,000 |
Make it work even harder
- Get the employer match. Many employers match part of what you put in. That's a third partner adding money, on top of the government and the market. At a minimum, contribute enough to get the full match.
- Consider a Roth 401(k). A Roth flips the deal: no tax break today, but withdrawals in retirement are tax-free. If you're early in your career or expect a higher tax rate later, the Roth may be the better trade.
- You'd be in rare company. Only 14% of Vanguard participants hit the limit in 2025. Maxing out puts you ahead of 86% of savers.
Scott Galloway says this a lot: I know how you can get rich, it just takes time and discipline.
I think about this in terms of a startup. Imagine you work for free for 10 years and finally exit. Along the way you take on $50,000 of debt a year, compounding at 10%. You exit for $1 million. You're a millionaire. Not quite, because the reverse magic is also true. That debt balance is now about $800,000, and after paying it off you're left with $200,000. Not exactly a millionaire.
Compounding and government support are the closest thing to the proverbial free lunch, but compounding works both ways.
When people hire me as their tax planner, this is the first thing I look at. Let's have the government and the market double your money first. Then we can get into the more complicated stuff.
Want a tax plan that starts here? Text me at 713-714-7153 or see how I work with individuals, families and business owners.
Private Client →Sources: IRS 401(k) contribution limits; US Department of Labor, Private Pension Plan Bulletin historical tables; Vanguard, How America Saves 2026 (via NAPA); S&P 500 annual total returns. Figures are rounded. The growth chart assumes the IRS limit contributed at each year end and invested in the S&P 500; the 10-year example assumes a 30% combined tax rate and a steady 10% return.
This article is general information, not tax, legal or investment advice for your situation. Past market returns don't predict future returns. A traditional 401(k) defers tax rather than eliminating it. Talk with your CPA and financial advisor before acting.